
Why is compressed air savings not reflected in energy consumption?
Hidden errors and energy efficiency in compressed air system design
 Figure 1. Centralized compressor control system in a paper mill. This figure shows a centralized control system for an industrial compressed air system that optimizes the operation and energy efficiency of multiple compressors according to varying air demand.
Technological developments in compressed air management
Technology is developing very rapidly in the control and monitoring of compressed air use. Many are already familiar with developments in the production side of compressed air, such as:
- Centralized compressor control systems that optimize the operation of multiple compressors according to varying demand
- variable speed drives (VSD)
- magnetic bearing centrifugal and screw compressors
- more efficient and reliable equipment thanks to modern manufacturing technology
These technologies enable significant energy savings and are heavily marketed by equipment manufacturers. The same development trend is also visible in production processes. These solutions are typical of:
- low investment cost
- clear savings
- often quick payback period
Yet they are often not actively sold or fully utilized. The reason for this may be a lack of comprehensive knowledge of both the production and consumption sides of compressed air systems and their deep expertise.
Can reducing compressed air consumption reduce energy consumption?
Compressed air is often the most expensive form of energy in a factory.
Typically you will need about:
- 8 kW of electrical power → to produce 1 kW of mechanical work with compressed air.
Before reducing consumption, it is necessary to ensure that the compressed air system is able to convert the lower air demand into lower energy consumption.
The importance of the production side in optimizing compressed air
Experience shows that optimizing the production side often yields greater savings than compressor changes alone. These include:
- production changes
- line additions
- hidden losses
Monitoring compressed air in production, i.e. the compressed air network, requires reliable and appropriate measurements to monitor KPI values*. Well-developed and organized measurement in itself is not sufficient if its regular and systematic monitoring is lacking. In example cases, information is transferred from monitoring to production management and from there to the practical level in the field for correct and precise actions.
*KPI (Key Performance Indicator) is a key performance indicator, key indicator or performance indicator in Finnish.
 Figure 2. Compressed air flow measurement for volume, flow and pressure control.
Measurement (KPIs) is critical:
- flow
- pressure
- consumption
- dew point
Without continuous monitoring, savings will not be achieved.
Compressed air system balance: production vs. consumption
On the supply side, it must be ensured that:
- Compressed air is produced with optimal efficiency
On the production side:
- only the necessary amount of air is used at the lowest possible pressure
The energy efficiency of a compressed air system arises from the balance between production and consumption.
The importance of the system as a whole
This article does not allow for a detailed discussion of all input-side factors. These include, for example:
- capacity control
- compressed air storage
- piping
- condensate treatment
All of these affect how effectively lower air consumption on the production side can be converted into lower energy consumption.
The most common problem: flow restrictions in the compressed air pipeline
Incorrect piping design causes:
- too high flow rates
- intersecting T-branches
- dead head structures
 Figure 3. Examples of incorrect design of compressed air piping. The figure illustrates incorrect design of compressed air piping, such as intersecting T-branches and flow restrictions that cause pressure losses.
Consequences:
- pressure losses
- flow resistance
- compressors operating at part load
Together, these create flow resistances that can lead to several - or even all - compressors running at partial load, meaning the compressors are unable to reach full load within the normal and acceptable operating range.
Example case: 5 compressor compressed air station
Let's look at a practical example of an industrial compressed air system. The system shown in Figure 4 consisted of several centrifugal compressors connected to a common main pipe (collector pipe / manifold).
According to the plant personnel, most of the compressors were operating at full load because the centralized control system (master controller) gave such a picture.
 Figure 4. Inaccurate compressed air piping design with pressure losses. This image shows the pressure losses and flow resistances in the compressed air piping that arise from suboptimal piping design and directly affect the operation and energy consumption of the compressors.
However, the real situation was different.
There were significant flow restrictions in the pipeline:
- intersecting T-branches
- so-called dead head structures
- local flow resistances
These caused back-pressure, to which the centrifugal compressors responded by increasing mass flow.
Critical consequence:
- mass flow increases
- but the delivered air volume (volume flow, Nm³/h) decreases
The system consumes more energy without increasing the useful air volume.
Why is this a challenge? The working principle of a centrifugal compressor
The compressors in the compressed air station are centrifugal compressors based on mass flow. This means that the compressor aims to maintain a certain mass flow (kg/s) and it reacts sensitively:
- back-pressure
- flow resistances
As resistance increases: mass flow increases, but volume flow decreases. The system consumes more energy without any additional benefit. This is one of the most common but unnoticed inefficiencies in compressed air systems.
 Figure 5. Compressor power requirements and air flows in a compressed air system. The figure shows the relationship between compressor power and air flow in a compressed air system and how flow restrictions can reduce the amount of air delivered.
As shown in Figure 5, the measured operating values of the five compressors shown in Figure 4 indicate that they were operating in conjunction with five other units supplying air to the same triple dead head structure. A total of ten compressors were loaded, with a total available airflow of 53,100 Nm³/h (31,241 scfm), of which 36,900 Nm³/h (21,706 scfm) was delivered to the system at 4.14 bar,g (60 psig), for a total power output of 3,319 kW.
Attention (important interpretation)
- Available (total airflow): 53,100 Nm³/h
- Actually delivered: 36,900 Nm³/h
About 30% of the % capacity is "lost" in the system, due to inappropriate design and implementation taking into account compressor technology.
This well illustrates the energy inefficiency of the: pipe flow restrictions → mass flow vs. volume flow problem. This is an extreme example. It illustrates that even if the production side compressed air consumption is reduced, the total energy consumption may not decrease at all or only slightly.
Some compressors are operating at partial load (turndown), while others are operating at blow-off, and the system had no overall control. In such a situation, a decrease in production air demand is likely to lead to an increase in blow-off, leaving the total electricity consumption almost unchanged.
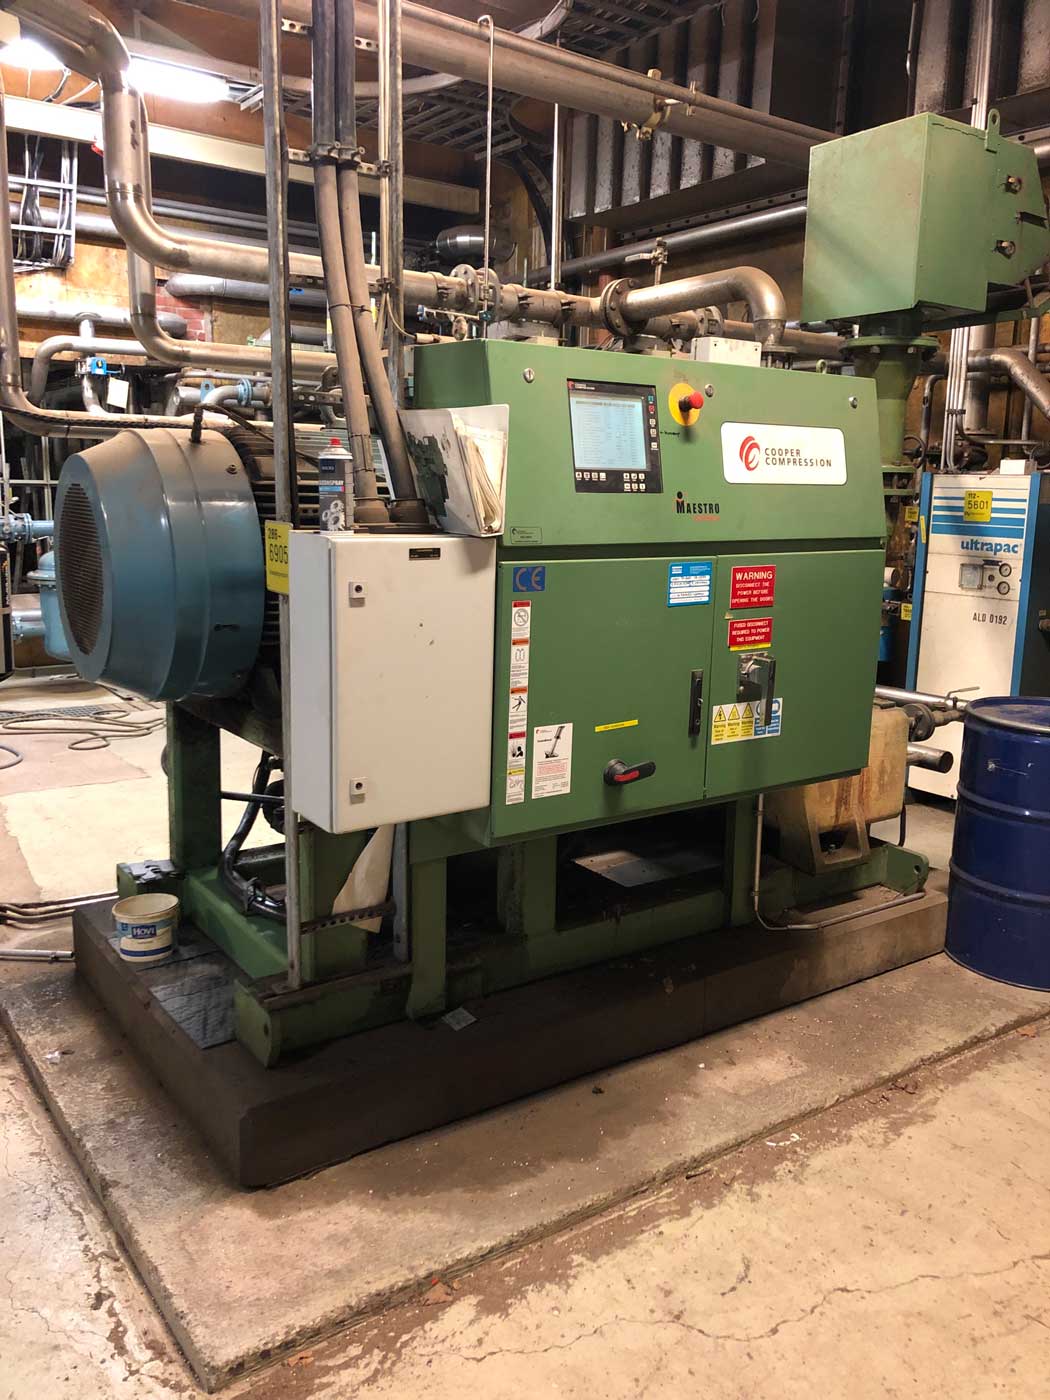 Figure 6. Oil-free centrifugal compressor in an industrial compressed air system.
Implemented changes and results
Two old 522 kW compressors were replaced with new, higher efficiency 932 kW compressors (with a more efficient control range).
- The 20" (DN500) main pipe was increased to 30" (DN750) stainless (Schedule 10).
- All connections were made as angle connections in line with the flow direction → turbulence caused by intersecting T-branches was eliminated.
- Triple dead head removed.
Results (Air flow 36,900 Nm³/h | Pressure 4.14 bar,g)
Before changes:
- Power: 3,139 kW
- Energy: 27,497,640 kWh/year (~27.5 GWh)
- Cost: 27,497,640 kWh × 0.09 €/kWh = €2,474,788/year
After the changes:
- Power: 2,796 kW
- Energy: 24,492,960 kWh/year (~24.5 GWh)
- Cost: 24,492,960 kWh × 0.09 €/kWh = €2,204,366/year
Savings:
- Power: -343kW (11 % lower power draw)
- Energy: -3.00 GWh/year
- Cost-effectiveness: €270,421/year
 Power requirements and loads after changes
 Figure 7. Optimized compressed air piping design without flow restrictions, which improves the energy efficiency of the entire system.
Important conclusion
New, larger and more efficient centrifugal compressors improved the full load specific efficiency by an estimated 10 %. The remainder of the savings came from piping repairs and better system design.
Core message
Simply replacing the compressors did not bring the greatest benefit. The largest energy savings came from correcting flow conditions.
Final summary
A similar phenomenon occurs regardless of the control method when the local capacity controllers of the compressors react to changes detected in the piping that are not due to the production process, but arise from conditions on the compressor room side or deficiencies in the design and implementation of the compressed air network.
Once all such problems have been solved and the production and consumption sides of the entire compressed air system have been connected to work properly, any reductions in air consumption can be directly converted into lower energy consumption.
Did you know? Volumetric flow vs. mass flow in a compressed air system (FAQ)
Sami Uusi-Erkkilä, Mechanical Engineer (AMK), is the entrepreneur of SmartAir, with 25 years of experience in industrial compressed air systems and extensive work experience in well-known companies in the industry. Read the original English article here

Compressed air system savings estimate
You will receive a preliminary estimate within 24 hours on weekdays. The estimate is non-binding.